The Con-Serve™ data management system by Considerate Hoteliers is enabled by a dynamic technology platform which has been tailored to capture data that is material to the hospitality industry. This includes: electricity, heat, water, waste and outsourced laundry, which can be correlated to occupied rooms and/or food covers. Users are uniquely equipped to identify inefficiencies that can substantially impact the performance of their businesses both environmentally and commercially. Con-Serve™ is constantly evolving, and this month we are thrilled to share the latest enhancements and new features.
Customised Dashboards & Automatic Report Scheduling
• View and download required chart overviews as soon as you’ve logged in
• Access customised report templates on the home screen under ‘Dashboards’
• Receive automated reports in your inbox at required intervals
Automatic Calculation of YoY Changes & Customisable Table Summaries
• View customised data tables below charts in Trend Analysis and Reports
• Add consumption, cost, emission, overlay and target meter totals to the table
• Click on the ‘Y-o-Y’ icon to instantly view % changes for any of the selected items
• Select required time period irrespective of the chosen chart resolution
Achieve Your KPI’s: Target Meters & Automated High-frequency Alerts
• Easily manage your KPI’s and energy budgets with target meters
• Compare actual performance against the target for any time period
• Instantly view the ‘Delta’: calculated difference against the target
• Receive automated alerts anytime consumption exceeds target
Rolling Average
• Track at a glance performance trends with the rolling average overlay
• Display a ‘rolling’ average performance for a selected number of preceding time periods
• Demonstrate continual reduction in consumption through a decreasing rolling average
• Flexible: select from 2 to 12 hourly, weekly, monthly and yearly rolling averages
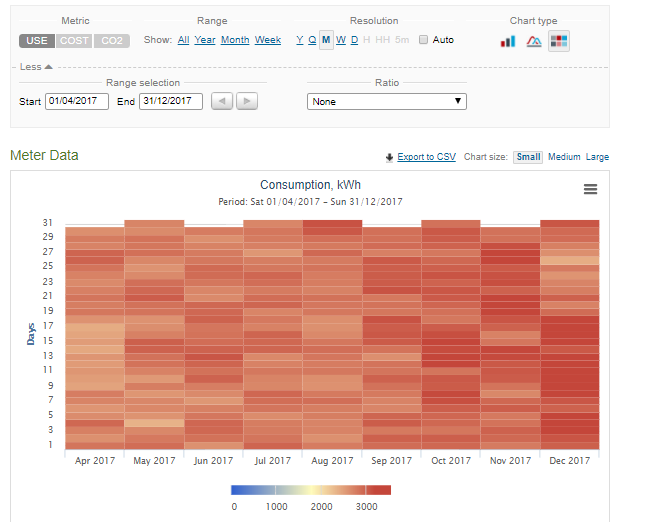
Heatmap Analysis
• New data visualisation through a heatmap
• Quick identification of hotspots
• Highlights at a glance hours, days, weeks or months in which the consumption has been highest/lowest
• Provides an actionable insight by highlighting patterns in the consumption
Virtual Metrics: Achieve the Virtually Impossible
• Measure consumption of specific areas without a physical sub-meter or any consumption data records
• Gain insight of consumption in non-metered areas
• Subtract, add, multiply or divide any of the tracked metrics
Mobile App
• View your latest utility costs and performance on-the-go
• Preview this week’s utility costs compared to the previous week’s expenses
• Enter meter readings on-the-go
Benefit From Automated Data Feeds Setup
• Fully benefit from the new Con-Serve™ features with automated data feeds
• Easy integration of data feeds into Con-Serve™ thanks to relationships with utility suppliers in the UK, Germany and France
CONTACT US BY EMAIL FOR MORE INFORMATION OR CALL +44 (0)20 3865 2052